An inheritance is the transfer of assets from one person to another upon death and can include cash, real estate, investment accounts, retirement funds, or business interests.The average inheritance amount in the United States is $46,200⁷, but that single number masks enormous variation across the wealth distribution. Among households in the bottom 50% the average drops to just $9,700,⁷ and for the roughly one in five Americans who actually receive an inheritance,²⁰ the median is $69,000 when assets pass outside a trust and $285,000 when they pass through one.⁷ Most Americans won’t receive an inheritance, but many expect to. Roughly one in five U.S. households has ever received a wealth transfer,²⁰ and that share drops to 17% for lower-income families and climbs to 28% for higher-income ones.¹¹ The money most often comes from parents,²⁰ but nearly two in three Americans still have no will in place.²²
The data below is sourced from the Federal Reserve’s 2022 Survey of Consumer Finances, the most comprehensive triennial study of U.S. household wealth available, alongside the Congressional Budget Office’s 2024 wealth distribution analysis, the NBER’s longitudinal inheritance research spanning 1989 to 2007, and current survey data from Northwestern Mutual, New York Life, and Cerulli Associates. In the sections below, we break down the average inheritance amount by wealth tier and socioeconomic status, examine what assets are most commonly transferred and to whom, and provide a forward looking analysis of the $124 trillion Great Wealth Transfer projected through 2048.
The Federal Reserve’s 2022 Survey of Consumer Finances breaks the national average into distinct population groups and trust structures, revealing that the difference between who receives an inheritance and how it is held produces a range of outcomes spanning from $46,200 to more than $4 million.
Average & Median Inheritance Amount in the United States7
| Population | Mean Inheritance
|
Median Inheritance
|
| All U.S. households
|
~$46,200 | not shown*
|
| Bottom 50% of households
|
~$9,700 | not shown*
|
| Recipients (no trust) | $707,291
|
$69,000
|
| Recipients (via trust) | $4,062,918
|
$285,000 |
**Median is not reported for these groups because the majority of households have never received an inheritance, which would place the median at $0.
● The national average of $46,200 is heavily distorted by large transfers at the top.Among the ~20% of households that actually receive an inheritance, the mean jumps to $707,291 (nearly 15x higher) illustrating how extreme outliers pull the average upward.
● Trust structures dramatically change the picture.Inheritances passed through a trust have a median of $285,000 and a mean of over $4 million, compared to $69,000 and $707,291 for non trust transfers. For most families, the absence of a trust is the single biggest factor suppressing inheritance value.
Inheritance Expectation 2026 Data
A 2024 Northwestern Mutual survey of nearly 4,600 U.S. adults reveals a consistent mismatch between what younger generations expect to receive and what their parents are actually planning to leave behind.
The Inheritance Expectation Gap by Generation
What Gen Z and millennials expect to inherit vs. the actual national average
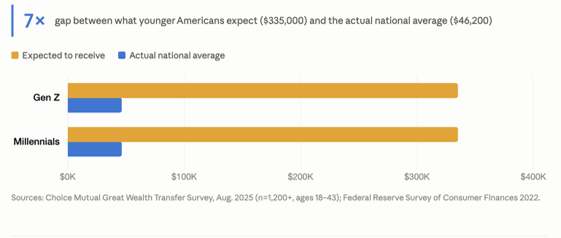
- Gen Z and Millennials expect to receive roughly 7 times the national average. Both generations anticipate inheriting $335,000, while the actual national average across all U.S. households is $46,200.⁷˒¹⁰
- The dollar gap reflects a broader misunderstanding of how concentrated inherited wealth actually is. The $335,000 figure reflects what younger Americans expect, not what most will receive. The median inheritance among actual recipients is $69,000, less than a quarter of that expectation.⁷
Inheritance Expectation vs. Reality, by Generation
Share expecting to receive an inheritance vs. share planning to leave one
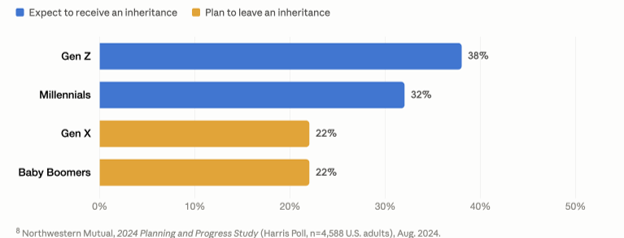
- Younger generations expect to inherit at rates 10 to 16 percentage points higher than their parents plan to leave. Gen Z leads at 38% expecting to receive, while both Gen X and Baby Boomers plan to leave an inheritance at identical rates of just 22%.
Inheritance by Demographic Data
That expectation gap doesn’t fall evenly across the population. How much someone inherits, and whether they inherit at all, is strongly predicted by other demographics.
Inheritance by Socioeconomic Status 11, 12
| Income Group | Ever Received Inheritance | Avg. Inheritance (conditional on receiving) |
| Lower class (bottom income third) | 17% | $141,000 |
| Middle class | ~21% | ~$69,000* |
| Upper class (top income third) | 28% | $490,000 |
*The CBO does not publish a conditional average separately for the middle income third. The ~$69,000 figure is the national median among recipients with no trust structure (SCF 2022), used here as the closest available middle class proxy.7 The incidence rate (~21%) comes from the NBER Wolff/Gittleman analysis of the overall share of households that have ever received a transfer.20
- Higher income families are more than one and a half times as likely to receive an inheritance, and receive transfers more than three times larger. The top third receives an average of $490,000 conditional on inheriting, versus $141,000 for the bottom third
- For families in the top 5% of income, inheritances are 4 to 12 times larger than those received by the bottom 80%.
The SCF data shows that parental education level is a stronger predictor of inheritance size than most expect, with children of college educated parents inheriting a median of $92,700 which is about 22% more than those whose parents did not attend college.
Median Inheritance by Parental Education Level1
| Demographics of Bequeathing Household | Median Inheritance Received |
| Parents with College Degree | $92,700 |
| Parents without College Degree | $76,200 |
- A college degree in the parent’s generation compounds into a $16,500 inheritance gap in the next, reflecting not just income variation but decades of diverging asset accumulation, homeownership rates, and retirement savings between degree holders and non degree holders.
Asset Type Breakdown
The Federal Reserve Bank of Richmond’s systemic breakdown reveals that a middle class inheritance is overwhelmingly an illiquid real estate asset like the family home, while a high net worth inheritance is often composed of liquid stocks and private business equity.
Portfolio Asset Class Split by Wealth Stratum3
| Asset Class | Middle Wealth Bracket (25th – 50th Percentile) | Upper-Middle Bracket (75th – 99th Percentile) | Ultra-Wealthy (Top 1% Percentile) |
| Real Estate | 155% of net worth (Highly Indebted) | 59% of portfolio | 23% of portfolio |
| Stocks & Mutual Funds | 13% of portfolio | 31% of portfolio | 31% of portfolio |
| Cash & Liquid Deposits | 15% of portfolio | 6% of portfolio | 2% of portfolio |
| Private Business Equity | 2% of portfolio | 9% of portfolio | 41% of portfolio |
| Vehicles & Other Assets | 29% of portfolio | 5% of portfolio | 1% of portfolio |
Note: Percentages can exceed 100% at lower percentiles due to offsetting mortgage debt liabilities.
- For middle class households, inheriting a home is not the same as inheriting liquid money. Real estate represents 155% of net worth for households in the 25th – 50th percentile which means many are net negative after mortgage obligations, leaving heirs with an asset that must be sold, maintained, or co-managed before any value can be realized.3
- Private business equity is nearly absent from middle class estates and dominant in very wealthy ones. At 2% vs. 41% of portfolio respectively, the composition gap between a middle class and wealthy estate is not just a difference in size, it’s also a difference in asset class entirely, with vastly different liquidity, tax treatment, and management complexity.3
Taken individually, these transfers are highly personal. But aggregated across tens of millions of aging households, they add up to one of the largest wealth events in modern economic history.
The Great Wealth Transfer
According to the latest market research from Cerulli Associates, an estimated $124 trillion is projected to change hands in the United States by 2048.14
The vast majority of this capital is coming from the Silent Generation and Baby Boomers, who benefited from decades of strong economic expansions, rising home values, and long term stock market growth. 13
Cerulli 6 breaks down where that $124 trillion is going:
- $105 trillion (85%) will flow directly to heirs (intergenerational).
- $18 trillion (15%) will be left to charities and philanthropic foundations.
- ~$1 trillion will cover transfer costs, estate administration, and legal fees.
That $124 trillion, however, is not distributed evenly across the population. The bulk of what’s being transferred is concentrated in a relatively small number of very wealthy households.
Total projected Wealth Transfer Through 2045/2048 by Generation
$124 trillion in total projected transfers. Cerulli Associates, 2024
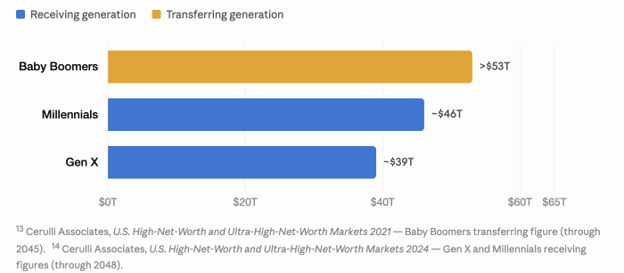
Note: the generational breakdown below reflects Cerulli’s original 2022 wealth transfer projection ($84.4 trillion through 2045). Cerulli’s 2024 update raised the total projection to $124 trillion through 2048, but does not publish a revised generation-level split, so the totals below will not sum to the updated $124T figure.
- Baby Boomers alone account for more than half the total projected transfer. Their $53+ trillion in outbound wealth represents 63% of the original 2045 projection
- Millennials are on track to receive more than Gen X in total, but Gen X gets there first. While Millennials lead the 25 year projection at ~$46 trillion vs. Gen X’s ~$39 trillion, Gen X is projected to receive $14 trillion in the next decade alone compared to $8 trillion for Millennials
Transfer by Wealth Bracket (Share Held by Top Earners)17, 18, 19
Despite the headline $124 trillion figure, CBO and Cerulli data make clear that the Great Wealth Transfer is not a broad based event, half of all projected transfers are expected to originate from households representing just 1.5 to 2% of the U.S. population, while the bottom 50% of families have held a fixed 6% share of total wealth since 1989.¹⁷˒¹⁸˒¹⁹
| Wealth Bracket | Share of Total U.S. Wealth (2022) | Notable Stat |
| Top 1% | 27% of all family wealth | Up from 23% in 1989 |
| Top 10% | 60% of all family wealth | Up from 56% in 1989 |
| Bottom 50% | 6% of all family wealth | Unchanged since 1989 |
| HNW households ($10M+ net worth) | ~45% of investable assets | ~2 million households (2% of all HH) |
| Expected share of $124T transfer from HNW/UHNW | ~42–50% | From 1.5 – 2% of all households |
- $35.8 trillion (42%) of the original $84.4T projection was expected to come from high-net-worth and ultra-high-net-worth households, which make up only 1.5% of all households. In the updated $124T projection, Glenmede cites approximately $62 trillion (50%) from HNW/UHNW households.
The average inheritance amount in the United States is $46,200, but the data in this report shows that figure varies significantly depending on income tier, asset composition, parental education, and race. As the $124 trillion Great Wealth Transfer accelerates through 2048, the gap between what younger Americans expect to receive and what their parents plan to leave behind remains one of the most consistent findings across the research and one of the most important variables for families and advisors to account for in long term financial planning.
References
1 Annuity.org. “Average Inheritance: How Much Do Americans Inherit?” Annuity.org. https://www.annuity.org/retirement/estate-planning/average-inheritance/
2 Penn Wharton Budget Model. “Inheritances by Age and Income Group.” Penn Wharton Budget Model, July 16, 2021. https://budgetmodel.wharton.upenn.edu/p/2021-07-16-inheritances-by-age-and-income-group/
3 Federal Reserve Bank of Richmond. “Portfolios Across the U.S. Wealth Distribution.” Economic Brief No. 23-39, October 2023. https://www.richmondfed.org/publications/research/economic_brief/2023/eb_23-39
4 Glenmede. “The Great Generational Wealth Transfer.” Glenmede, December 2025. https://www.glenmede.com/insights-private-wealth/the-great-generational-wealth-transfer/
5 See footnote 13
6 Cerulli Associates. U.S. High-Net-Worth and Ultra-High-Net-Worth Markets 2024. Cerulli Associates, 2024. https://www.cerulli.com/reports/us-high-net-worth-and-ultra-high-net-worth-markets-2024
7 Board of Governors of the Federal Reserve System. “Survey of Consumer Finances, 2022.” Federal Reserve, October 2023. https://www.federalreserve.gov/econres/scfindex.htm
8 Northwestern Mutual. “2024 Planning and Progress Study.” Northwestern Mutual/Harris Poll, August 6, 2024. https://news.northwesternmutual.com/2024-08-06-As-90-Trillion-Great-Wealth-Transfer-Approaches,-Just-1-in-4-Americans-Expect-to-Leave-an-Inheritance
9 New York Life. “Wealth Watch Survey.” New York Life, 2023. https://www.newyorklife.com/newsroom/2023/new-york-life-wealth-watch-great-wealth-transfer
10 Choice Mutual. “Great Wealth Transfer Survey.” Choice Mutual, August 2025. https://choicemutual.com/blog/great-wealth-transfer/
11 Congressional Budget Office. “Trends in the Distribution of Family Wealth, 1989 to 2022.” Congressional Budget Office, October 2024. https://www.cbo.gov/publication/60807
12 Penn Wharton Budget Model. “Inheritances by Age and Income Group.” Penn Wharton Budget Model, July 16, 2021. https://budgetmodel.wharton.upenn.edu/issues/2021/7/16/inheritances-by-age-and-income-group
13 Cerulli Associates. “Cerulli Anticipates $84 Trillion in Wealth Transfers Through 2045.” Cerulli Associates Press Release, January 2022. https://www.cerulli.com/press-releases/cerulli-anticipates-84-trillion-in-wealth-transfers-through-2045
14 Cerulli Associates. “Cerulli Anticipates $124 Trillion in Wealth Will Transfer Through 2048.” Cerulli Associates Press Release, December 5, 2024. https://www.cerulli.com/press-releases/cerulli-anticipates-124-trillion-in-wealth-will-transfer-through-2048
15 see footnote 4
16 Bank of America Private Bank. “2026 Study of Wealthy Americans.” Bank of America, 2026. https://www.privatebank.bankofamerica.com/articles/study-of-wealthy-americans.html
17 See footnote 11
18 see footnote 13
19 see footnote 4
20 Wolff, Edward N. and Maury Gittleman. “Inheritances and the Distribution of Wealth.” NBER Working Paper No. 16840, February 2011. https://www.nber.org/system/files/working_papers/w16840/w16840.pdf
21 Board of Governors of the Federal Reserve System. “How Does Intergenerational Wealth Transmission Affect Wealth Concentration?” FEDS Notes, June 2018. https://www.federalreserve.gov/econres/notes/feds-notes/how-does-intergenerational-wealth-transmission-affect-wealth-concentration-20180601.html
22 Caring.com. “2024 Wills and Estate Planning Study.” Cited in Worth, June 2025. https://worth.com/84-trillion-wealth-transfer-will-your-familys-wealth-last-or-disappear/
23 Trust and Will. “2025 Estate Planning Report.” Trust and Will, March 2026. https://trustandwill.com/learn/2025-report-estate-planning-demographic-breakdown
24 Federal Reserve Bank of Richmond. “How Big Is the Inheritance Gap Between Black and White Families?” Economic Brief No. 22-49, December 2022. https://www.richmondfed.org/publications/research/economic_brief/2022/eb_22-49
25 Federal Reserve Bank of Boston. “Racial Wealth Disparities: Reconsidering the Roles of Human Capital and Inheritance.” Research Department Working Paper, February 2022. https://www.bostonfed.org/publications/research-department-working-paper/2022/racial-wealth-disparities-reconsidering-the-roles-of-human-capital-and-inheritance.aspx