The following risk management statistics report was compiled from data published between 2024 and 2026 by primary sources including Marsh, RIMS, the Nilson Report, IBM, the Association of Certified Fraud Examiners, the FBI, the NAIC, and Fenergo. It organizes the numbers that matter most to financial decision-makers into five areas: the cost of risk, the financial risk management market, fraud and financial crime, cyber and data breach risk, and regulatory fines. The opening table in each section is built to answer its question on its own; the supporting tables add the breakdowns most readers ask for next. Every figure is cited, and where current full-year data does not yet exist, the most recent reported figure is shown and labeled.
1. The Cost of Risk
Every organization pays for risk twice: once to prevent and insure against it, and again when losses slip through anyway. This section measures that combined burden, known as the Total Cost of Risk, and shows where it is heading.
Total Cost of Risk (TCOR) measures everything an organization spends to manage and absorb risk: insurance premiums, retained (uninsured) losses, and the administrative and risk-control costs of running a risk program.4 The longest-running public benchmark, the RIMS Benchmark Survey, expresses TCOR per $1,000 of revenue so organizations of different sizes can compare. In its most recent published edition, TCOR reached $9.95 per $1,000 of revenue, or roughly 1% of revenue.1
Total Cost of Risk per $1,000 of Revenue: 2010-2018
| Year | TCOR per $1,000 revenue | Year-over-year change |
| 2010 | $10.02 | n/a |
| 2011 | $10.19 | +1.7% |
| 2012 | $10.70 | +5.0% |
| 2013 | $10.90 | +2.0% |
| 2015 | $10.55 | -3.2% |
| 2016 | $10.07 | -4.5% |
| 2017 | $9.75 | -3.2% |
| 2018 | $9.95 | +2.0% |
Source: RIMS Benchmark Survey (produced with Advisen). 2018 is the most recent publicly released edition. A clean 2014 figure was not separately published.
TCOR has three components. Insurance premiums (risk transfer) are usually the largest, followed by retained losses, then the administrative cost of the risk-management function itself.4 The table below defines each component.
The Three Components of Total Cost of Risk
| Component | What it includes |
| Risk transfer (premiums) | Insurance premiums across all coverage lines; typically the single largest component of TCOR. |
| Retained losses | Claims and direct costs of uninsured or self-insured events, including deductibles, lost income, and non-insurable losses. |
| Administrative / risk-control costs | Risk-management staff, technology and systems, brokerage and consulting fees, and loss-control programs. |
Source: Arthur D. Little, 2024 Total Cost of Risk; RIMS Benchmark Survey methodology.
The premium component is the most visible driver of TCOR year to year, and it has shifted sharply. After roughly seven years of rising commercial insurance rates, the market softened in 2025: global commercial rates fell every quarter and ended the year down about 3%.56 That reversal follows mid-cycle increases such as the 5.9% U.S. commercial rate rise reported in mid-2024.7
Global Commercial Insurance Rate Change: 2024-2026
| Period | Change in commercial insurance rates |
| Q2 2024 (U.S.) | +5.9% |
| Q1 2025 (global) | -2% |
| Q2 2025 (global) | -4% |
| Q3 2025 (global) | -4% |
| Q4 2025 (global) | -4% |
| Full-year 2025 (global) | approx. -3% |
Sources: Marsh Global Insurance Market Index (2025); WTW Commercial Lines Insurance Pricing Survey (Q2 2024).
A note on availability: RIMS discontinued public release of the TCOR-per-$1,000 benchmark after the 2018 edition, and current broker TCOR benchmarks are proprietary. Industry-sector and 2020-2026 per-$1,000 figures are therefore not available from a free, citable source; the rate-change data above is the best current public indicator of where the premium component of TCOR is heading.
Key Takeaways
- Total Cost of Risk was last publicly benchmarked at $9.95 per $1,000 of revenue, or roughly 1% of revenue.
- Insurance premiums are typically the largest of TCOR’s three components, alongside retained losses and administrative costs.
- After about seven years of increases, global commercial insurance rates fell roughly 3% in 2025, easing the premium-driven share of TCOR.
2. Financial Risk Management Market Size
The size of the risk-management industry is a useful proxy for how seriously your money is being protected. As financial risk grows more complex, the firms and institutions that safeguard your wealth are spending more on the technology that identifies, analyzes, and controls it. This section sizes that market and shows which segments are growing fastest.
Spending on risk technology is growing across every category. The four core segments of the financial risk management market, governance/risk/compliance (GRC) software, risk analytics, fraud detection and prevention, and regtech, together represent roughly $181 billion in 2025.891011 The table below shows each segment’s size and growth.
Financial Risk Management Market by Segment: 2024-2026
| Segment | 2024 | 2025 | 2026 (proj.) | Share of total (2025) |
| GRC software | $62.9B | $71.2B | $80.6B | 39.3% |
| Risk analytics | $44.6B | $50.2B | $56.6B | 27.7% |
| Fraud detection & prevention | $29.9B | $35.3B | $40.4B | 19.5% |
| Regtech | $20.1B | $24.3B | $29.5B | 13.4% |
Sources: Grand View Research segment reports (2024-2026). Anchor-year values are published; intervening years derived from each report’s stated CAGR. Segments overlap and are not mutually exclusive; share = each segment’s portion of the four-segment total.
North America leads every segment, reflecting the concentration of large financial institutions and the strictest enforcement environment. Asia-Pacific is the fastest-growing region across all four categories, with Europe consistently second.1011
North America Share of Each Market Segment (Most Recent Year)
| Segment | North America share |
| GRC software | 34.2% |
| Risk analytics | 39.0% |
| Fraud detection & prevention | 39.0% |
| Regtech | 40.8% |
Source: Grand View Research segment reports. Latin America and Middle East & Africa are typically grouped under “Rest of World” and not separately published.
Within the narrower category of dedicated financial risk management software, the market is smaller but expanding at a double-digit pace, from about $3.7 billion in 2024 to a projected $4.8 billion in 2026.1213
Financial Risk Management Software Market: 2022-2026
| Year | Market size | Status |
| 2022 | $2.87B | Reported |
| 2023 | $3.27B | Reported |
| 2024 | $3.74B | Base year |
| 2025 | $4.28B | Estimate |
| 2026 | $4.79B | Projection |
Sources: Precedence Research; Fortune Business Insights. Approx. 13% annual growth across 2024-2026; forward CAGR of 13.6%-14.4% projected through the early 2030s.
Key Takeaways
- The four core risk-technology segments (GRC, risk analytics, fraud detection, regtech) total roughly $181 billion in 2025.
- GRC software is the largest segment at $71.2 billion (39.3% of the total); regtech is the fastest-growing.
- North America leads every segment with 34%-41% share, while Asia-Pacific grows fastest.
- The dedicated financial risk management software market is projected to reach $4.8 billion in 2026, growing about 13% a year.
3. Fraud & Financial Crime
Fraud is the most direct and fastest-moving financial risk you face. This section quantifies the losses by type, identifies who is hit hardest, and shows what institutions spend to fight back on your behalf.
Fraud losses keep climbing, but the figures come from sources that measure different populations, so they should be read separately rather than added together. The table below shows the headline losses by type and source, with the most recent reported year for each.141516171819
Reported Fraud Losses by Type and Source: 2024-2025
| Type / source | 2024 | 2025 | Year-over-year |
| Payment card fraud, global 14 | $33.4B | Not yet reported | -1.2% vs 2023 |
| Identity fraud, U.S. consumers 1516 | $27.2B | $27.3B | +0.4% |
| Consumer-reported fraud, U.S. (FTC) 1718 | $12.5B | $15.9B | +27% |
| Internet crime, U.S. (FBI IC3) 19 | $16.6B | Not yet published | +33% vs 2023 |
Sources: Nilson Report; Javelin Strategy & Research; FTC Consumer Sentinel; FBI Internet Crime Complaint Center. Different methodologies; figures are not additive.
Internal (occupational) fraud is tracked separately by the ACFE, whose 2024 Report to the Nations identified $3.1 billion in losses across 1,921 cases, with a median loss of $145,000 per case, up 24% from its prior edition.20 Losses are highest at the smallest and the largest organizations.
Median Occupational Fraud Loss by Organization Size
| Organization size | Median loss per case |
| Fewer than 100 employees | $141,000 |
| 100-999 employees | $120,000 |
| 1,000-9,999 employees | $119,000 |
| 10,000+ employees | $200,000 |
Source: ACFE, Occupational Fraud 2024: A Report to the Nations (biennial; 2024 is the current edition). Overall median across all sizes: $145,000.
The cost of fighting financial crime is itself substantial. Financial institutions spend an estimated $206 billion a year worldwide on financial-crime compliance, and 98% report that those costs are rising.21
Annual Financial-Crime Compliance Spending by Region
| Region | Annual compliance spend |
| Global total | $206.1B |
| Europe, Middle East & Africa | $85B |
| United States & Canada | $61B |
| Asia-Pacific | $45B |
Source: LexisNexis Risk Solutions, True Cost of Financial Crime Compliance Study (Forrester Consulting).
Key Takeaways
- Global payment-card fraud reached $33.4 billion in 2024; U.S. consumer-reported fraud hit a record $15.9 billion in 2025.
- Occupational fraud carries a median loss of $145,000 per case, highest at the smallest and the largest organizations.
- Financial institutions spend an estimated $206 billion a year worldwide fighting financial crime, and 98% say those costs are rising.
Concerned about fraud and identity theft as you approach retirement? Our advisors build safeguards into every plan. Learn more about financial planning at YTS Wealth Management.
4. Cyber & Data Breach Risk
When you trust a firm with your financial data, a breach becomes your problem too. This section covers what breaches cost financial-services firms, how attackers get in, and the insurance market that absorbs the losses.
Financial services is the second most expensive industry for data breaches, behind only healthcare. The average breach in the sector cost $5.56 million in the latest IBM study, down from $6.08 million a year earlier, while detection and containment times improved.2526
Data Breach Cost & Lifecycle: Financial Services and Global
| Metric | 2024 | 2025 |
| Avg. breach cost, financial services | $6.08M | $5.56M |
| Avg. breach cost, all industries | $4.88M | $4.44M |
| Mean time to identify + contain (days) | 258 | 241 |
| of which, time to identify (days) | 194 | 158 |
| of which, time to contain (days) | 64 | 83 |
Source: IBM Cost of a Data Breach Report (2024 and 2025 editions). The 2026 edition is expected mid-2026; lifecycle figures are global means.
Breach cost varies by how attackers get in. Malicious insiders and third-party/supply-chain compromises are the most expensive entry points, while phishing remains the most common.25
Average Data Breach Cost by Initial Attack Vector
| Initial attack vector | Average cost per breach |
| Malicious insider | $4.92M |
| Third-party / supply chain | $4.91M |
| Phishing (most common, 16% of breaches) | $4.80M |
| Stolen or compromised credentials | $4.67M |
| Breach spanning multiple environments | $5.05M |
Source: IBM Cost of a Data Breach Report 2025 (global, all industries).
The cyber insurance market that backstops these losses has matured. After years of rapid premium growth, U.S. cyber direct premiums declined for the first time in 2024, while underwriting stayed profitable with loss ratios below 50%.
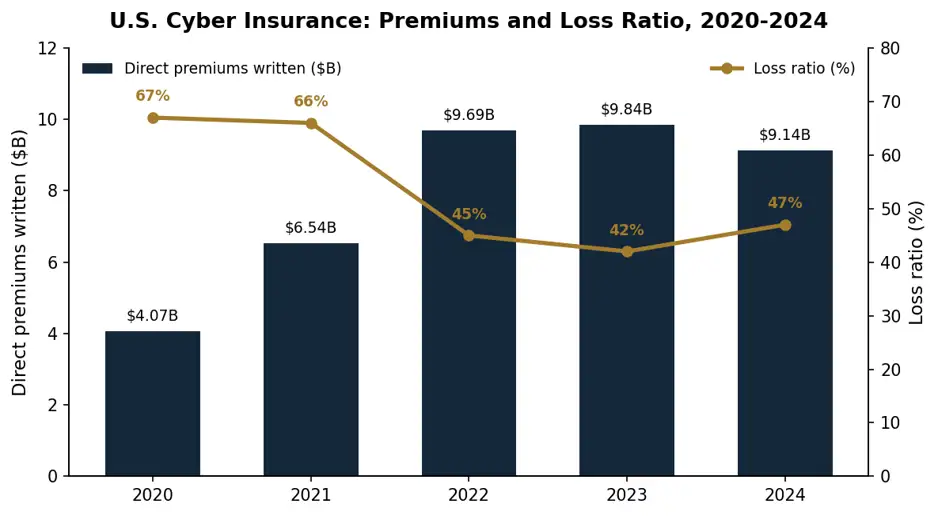
Sources: NAIC Report on the Cybersecurity Insurance Market (2025); Fitch Ratings. Premiums include alien surplus lines. Loss ratios are assembled from NAIC and rating-agency commentary; a 2024 supplement restructuring limits exact year-over-year comparability.
Key Takeaways
- The average financial-services data breach cost $5.56 million, the second-highest of any industry behind healthcare.
- Malicious insiders and supply-chain compromises are the costliest entry points; phishing is the most common.
- S. cyber insurance premiums declined for the first time in 2024 while underwriting stayed profitable, with a loss ratio near 47%.
5. Regulatory Fines & Compliance Costs
Regulation imposes a second layer of financial risk: the cost of getting compliance wrong, and the standing cost of getting it right. This section tracks both the penalties levied on financial institutions and what compliance itself costs.
Global penalties against financial institutions for anti-money-laundering, know-your-customer, and sanctions failures have declined for two straight years, falling to $3.8 billion in 2025.2930 Totals swing heavily on a handful of mega-penalties, such as the roughly $3.09 billion TD Bank settlement that dominated 2024.
Global Financial-Institution Penalties by Year
| Year | Total penalties | Year-over-year |
| 2023 | $6.6B | n/a |
| 2024 | $4.6B | -30% |
| 2025 | $3.8B | -18% |
Source: Fenergo (global AML/KYC/sanctions penalties). 2026 full-year data is not yet available. For context, the U.S. SEC reported a record $8.2 billion in total enforcement financial remedies across 583 actions in fiscal year 2024.
Anti-money-laundering and transaction-monitoring failures account for the largest share of penalty dollars, while sanctions enforcement rose in 2025.3031 The table below shows the leading enforcement themes by value.
Leading Enforcement Themes by Penalty Value
| Violation category | Penalty value | Year |
| AML / transaction-monitoring failures | $3.3B | 2024 |
| Sanctions violations | approx. $243M | 2025 |
| Suspicious-activity reporting failures | approx. $45M | 2025 |
| ESG-related disclosures | $37.7M (+98%) | 2024 |
Source: Fenergo enforcement analysis. Categories reflect the largest publicly reported penalty themes, not an exhaustive split of all fines.
Compliance is a standing cost of doing business, and it weighs most heavily on smaller institutions, which lack the scale to spread fixed compliance overhead. Community banks devote a far larger share of personnel expense to compliance than their larger peers.34
Compliance Cost as a Share of Personnel Expense, by Bank Size
| Institution size | Compliance cost as % of personnel expense |
| Smaller / community banks | 11.0% – 15.5% |
| Larger banks | 5.6% – 9.6% |
Source: Conference of State Bank Supervisors (CSBS), 10-year community bank compliance cost study.
Key Takeaways
- Global financial-institution penalties fell to $3.8 billion in 2025, declining for a second straight year.
- AML and transaction-monitoring failures account for the largest share of penalty dollars.
- Compliance costs hit smaller banks hardest, consuming 11%-15.5% of personnel expense versus 5.6%-9.6% at larger banks.
Turning Risk Statistics Into a Plan
Taken together, these statistics point to a single conclusion: financial risk is large, varied, and rising in most categories, but it is also measurable and manageable. The organizations and individuals who fare best are the ones who quantify their exposure, transfer what they can, and plan deliberately for what they retain.
References
- RIMS, 2019 RIMS Benchmark Survey (TCOR $9.95 per $1,000 of revenue, 2018). https://www.rims.org/about-us/newsroom/2019-rims-benchmark-survey-now-available
- RIMS, 2018 RIMS Benchmark Survey (TCOR declines for fourth year, 2017 = $9.75). https://www.rims.org/about-us/newsroom/rims-2018-benchmark-survey-tcor-declines-for-fourth-year-amid-a-highly-competitve-market
- RIMS, 2014 RIMS Benchmark Survey (2013 = $10.90 per $1,000). https://www.rims.org/about-us/newsroom/rims-benchmark-survey-two-percent-increase-in-tcor-reflects-the-influence-of-a-hardening-market
- Arthur D. Little, 2024 Total Cost of Risk (Viewpoint). https://www.adlittle.com/sites/default/files/viewpoints/ADL_Total_cost_of_risk_2024.pdf
- Marsh, Global Insurance Market Index, Q4 2025 (rates fall 4% in Q4 2025). https://www.marsh.com/en/about/media/global-commercial-insurance-rates-fall-4-percent-in-q4-2025.html
- Marsh, Global Insurance Market Index 2025 (quarterly rate trends). https://www.marsh.com/en/services/international-placement-services/insights/global-insurance-market-index.html
- WTW, Commercial Lines Insurance Pricing Survey (CLIPS), Q2 2024 (U.S. rates +5.9%). https://www.wtwco.com/en-us/news/2024/09/us-commercial-insurance-rates-show-an-aggregate-increase-near-6-percent
- Grand View Research, Enterprise Governance, Risk & Compliance (eGRC) Market. https://www.grandviewresearch.com/industry-analysis/enterprise-governance-risk-compliance-egrc-market
- Grand View Research, Risk Analytics Market Size, Share & Trends. https://www.grandviewresearch.com/industry-analysis/risk-analytics-market-report
- Grand View Research, Fraud Detection and Prevention Market Size Report. https://www.grandviewresearch.com/industry-analysis/fraud-detection-prevention-market
- Grand View Research, RegTech Market Size, Share & Trends. https://www.grandviewresearch.com/industry-analysis/regulatory-technology-market
- Precedence Research, Financial Risk Management Software Market (base year 2024, $3.74B). https://www.precedenceresearch.com/financial-risk-management-software-market
- Fortune Business Insights, Financial Risk Management Software Market ($4.79B 2026). https://www.fortunebusinessinsights.com/financial-risk-management-software-market-110329
- The Nilson Report, Card Fraud Losses Worldwide 2024 (Issue 1298, Jan 2026; $33.41B). https://nilsonreport.com/articles/card-fraud-losses-worldwide-2024/
- Javelin Strategy & Research, 2025 Identity Fraud Study (2024 losses $27.2B). https://javelinstrategy.com/research/2025-identity-fraud-study-breaking-barriers-innovation
- Javelin Strategy & Research, 2026 Identity Fraud Study (2025 losses $27.3B). https://javelinstrategy.com/press-release/fraud-losses-stabilize-ai-driven-threats-are-eroding-trust
- Federal Trade Commission, Consumer Sentinel Network Data Book 2024 ($12.5B reported losses). https://www.ftc.gov/news-events/news/press-releases/2025/03/new-ftc-data-show-big-jump-reported-losses-fraud-125-billion-2024
- Federal Trade Commission, 2025 fraud-loss disclosure ($15.9B reported in 2025). https://www.ftc.gov/news-events/news/press-releases/2026/04/new-ftc-data-show-people-have-lost-billions-social-media-scams
- FBI Internet Crime Complaint Center, 2024 Internet Crime Report ($16.6B losses). https://www.ic3.gov/AnnualReport/Reports/2024_IC3Report.pdf
- ACFE, Occupational Fraud 2024: A Report to the Nations ($3.1B losses; median $145,000). https://legacy.acfe.com/report-to-the-nations/2024/
- LexisNexis Risk Solutions, True Cost of Financial Crime Compliance Global Study, 2023 ($206.1B). https://risk.lexisnexis.com/about-us/press-room/press-release/20230926-global-financial-crime-compliance-costs
- LexisNexis Risk Solutions, True Cost of Compliance, United States & Canada ($61B). https://risk.lexisnexis.com/about-us/press-room/press-release/20240221-true-cost-of-compliance-us-ca
- LexisNexis Risk Solutions, True Cost of Compliance, EMEA ($85B). https://risk.lexisnexis.com/global/en/about-us/press-room/press-release/20240306-true-cost-of-compliance-emea
- LexisNexis Risk Solutions, True Cost of Compliance, Asia Pacific ($45B). https://risk.lexisnexis.com/global/en/about-us/press-room/press-release/20240306-true-cost-of-compliance
- IBM, Cost of a Data Breach Report 2025 (financial services $5.56M; attack-vector costs). https://www.ibm.com/reports/data-breach
- IBM, Cost of a Data Breach 2024: Financial industry ($6.08M). https://www.ibm.com/think/insights/cost-of-a-data-breach-2024-financial-industry
- NAIC, Report on the Cybersecurity Insurance Market (2025) (premiums and loss ratios). https://content.naic.org/sites/default/files/inline-files/2025_Cybersecurity_Insurance%20Report.pdf
- Reinsurance News / Fitch Ratings, U.S. cyber insurance market profitability, 2024. https://www.reinsurancene.ws/us-cyber-insurance-market-remains-profitable-amid-slower-growth-in-2024-fitch/
- Fenergo, Global financial regulatory penalties fall 18% in 2025. https://resources.fenergo.com/newsroom/global-financial-regulatory-penalties-fall-by-18-in-2025-as-enforcement-shifts-from-us-to-emea-and-apac
- Fenergo, Regulatory penalties analysis, 2024 ($4.6B; transaction monitoring $3.3B). https://resources.fenergo.com/reports/aml-enforcement-action-in-2024
- Fenergo, Regulatory penalties skyrocket 417% in H1 2025. https://resources.fenergo.com/newsroom/regulatory-penalties-for-global-financial-institutions-skyrocket-417-in-h1-2025
- U.S. SEC, Enforcement Results for Fiscal Year 2024 ($8.2B; 583 actions). https://www.sec.gov/newsroom/press-releases/2024-186
- UK FCA, Enforcement and fines data. https://www.fca.org.uk/data/fca-operating-service-metrics-2024-25/enforcement-data
- Conference of State Bank Supervisors (CSBS), Community bank compliance cost study. https://www.csbs.org/too-small-scale-what-10-years-data-say-about-community-bank-compliance-costs
*The opinions voiced in this material are for general information only and are not intended to provide specific advice or recommendations for any individual. All performance referenced is historical and is no guarantee of future results. All indices are unmanaged and may not be invested into directly.