This report compiles the most recent retirement statistics for the United States. The data was aggregated from reports published between 2024 and 2026 by Vanguard, Fidelity, the Federal Reserve, the Employee Benefit Research Institute, the Social Security Administration, and the U.S. Census Bureau. It is organized into five areas: account balances, the savings gap, participation and contributions, income sources, and readiness. The chart below sets the baseline, showing the gap between what the average and the typical saver hold at each age.
Retirement Savings Balances by Age and Income
If you want to know how your savings compare, the clearest baseline comes from Vanguard’s recordkeeping data covering roughly 5 million defined contribution participants. The table below shows average and median 401(k) balances by age at year-end 2024.1
Figure 1. Average vs. median 401(k) balance by age, year-end 2024.
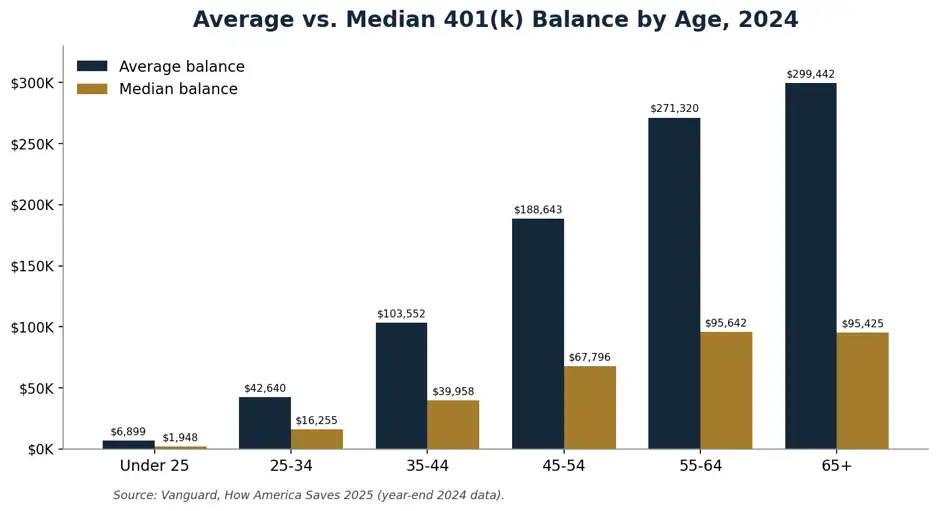
The gap between the average and the median is the headline finding: a small number of very large accounts pulls the average up to roughly four times the median. The typical participant held about $38,176, and 28% of participants had less than $10,000 saved.1 The picture narrows further across all households: only 54.3% of U.S. households held any retirement account at all in 2022.5
Account balances also move with markets. The next table tracks Fidelity’s average 401(k) balance from 2020 through 2025, showing the 2022 market drop and the three years of double-digit recovery that followed.
Average 401(k) Balance Trend: 2020 to 2025
| Year-End | Average 401(k) Balance | Year-over-Year Change |
| 2020 | $121,500 | n/a |
| 2021 | $130,700 | +7.6% |
| 2022 | $103,900 | -20.5% |
| 2023 | $118,600 | +14.1% |
| 2024 | $131,700 | +11.0% |
| 2025 | $146,400 | +11.2% |
Table 2. Average 401(k) balance trend, year-end 2020 to 2025. Sources: Fidelity Q4 2025, Q4 2024, and 2020 to 2022 analyses.
Average balances rose across both major account types in 2025: the average 401(k) reached $146,400 and the average IRA reached $137,095, up 7% over the prior year.2 Whole-household data from the Federal Reserve, which counts all retirement accounts rather than a single 401(k), shows balances peaking just before and during early retirement, then drawing down.
Mean Retirement Account Balance by Age, All Accounts: 2022
| Age of Household Head | Mean Retirement Account Balance |
| Under 35 | $49,130 |
| 35-44 | $141,520 |
| 45-54 | $313,220 |
| 55-64 | $537,560 |
| 65-74 | $609,230 |
| 75 and older | $462,410 |
Table 3. Mean retirement account balance by age, among households that hold accounts, 2022. Source: Federal Reserve Survey of Consumer Finances 2022 (CRS analysis).
Income is the strongest single predictor of whether a worker saves at all. Among Vanguard participants, 95% of those earning $150,000 or more contributed to their plan, compared with just 31% of those earning under $15,000.1
The Retirement Savings Gap: How Far Behind Americans Are
Balances tell you what people have saved; the savings gap tells you whether it is enough. The table below assembles the leading shortfall indicators across recent studies.
Retirement Savings Shortfall Indicators: 2024 to 2026
| Shortfall Indicator | Figure | Source |
| Aggregate U.S. retirement savings shortfall, households ages 35-64 | $3.48 trillion6 | EBRI |
| Working-age households at risk of not maintaining their standard of living | 39%7 | CRR Boston College |
| Non-retirees who feel their retirement savings are on track | 35%8 | Federal Reserve |
| Retirees who say they saved less than they needed | 50%6 | EBRI |
| Adults age 50 and older with no retirement savings | 20%10 | AARP |
Table 4. Retirement savings shortfall indicators, 2024 to 2026. Sources: EBRI, CRR Boston College, Federal Reserve, AARP.
The gap is largest for the generation closest to retiring without a traditional pension. Schroders’ survey asked non-retired workers what they think they need versus what they expect to actually have saved.
Self-Reported Retirement Savings Gap by Generation: 2024
| Generation | Savings Gap (Need Minus Expected) |
| Gen X | $466,802 |
| Baby Boomers | $353,069 |
| Millennials | $322,128 |
Table 5. Self-reported retirement savings gap by generation, 2024. Source: Schroders 2024 U.S. Retirement Survey.
Gen X workers said they will need about $1,069,746 to retire but expect to have only $602,944, the widest gap of any group.9 A more fundamental problem sits underneath the gap: a large share of Americans have not started at all.
Americans With No Retirement Savings: 2022 to 2024
| Group | Share With No Retirement Savings |
| Adults age 50 and older | 20%10 |
| Non-retired adults (all ages) | 36%8 |
| All U.S. households | 46%5 |
Table 6. Share with no retirement savings, by group, 2022 to 2024. Sources: AARP, Federal Reserve, Survey of Consumer Finances.
401(k) Participation and Contribution Rates
Saving behavior improves sharply once workers are inside a plan. The three largest recordkeeper and sponsor surveys report participation and contribution rates side by side below; the figures differ because each measures a different population, so all three are shown rather than blended.
401(k) Participation and Contribution Rates: 2024
| Metric (2024 plan year) | Vanguard | PSCA | Fidelity |
| Participation rate among eligible employees | 85%1 | 87.4%11 | n/a |
| Average employee deferral rate | 7.7%1 | 7.7%11 | 9.5%2 |
| Average employer contribution | 4.6%1 | 4.8%11 | 4.8%2 |
| Total combined savings rate | 12.0%1 | 12.5%11 | 14.2%2 |
Table 7. 401(k) participation and contribution rates, 2024. Sources: Vanguard, PSCA, Fidelity.
Plan design matters more than almost any other factor. Automatic enrollment closes most of the participation gap, and its effect is visible across both small and large plans.
401(k) Participation by Plan Size and Enrollment Design: 2024
| Plan Size | Participation With Auto-Enrollment | Participation With Voluntary Enrollment |
| Small plans | 82% | 52% |
| Large plans | 94% | 65% |
Table 8. 401(k) participation rate by plan size and enrollment design, 2024. Source: Vanguard, How America Saves 2025.
Auto-enrollment adoption has climbed steadily, from 10% of Vanguard plans in 2006 to 61% in 2024, and reaches 78% among plans with 1,000 or more participants.1 Plans that use it see 94% participation versus 64% for voluntary enrollment.1 This trend now has a legal tailwind: under the SECURE 2.0 Act, most new 401(k) and 403(b) plans must automatically enroll eligible employees beginning January 1, 2025, at an initial rate of 3% to 10% with annual 1% escalation.13
Social Security and Retirement Income Sources
Retirement income rarely comes from savings alone. The table below shows how the income of Americans age 65 and older breaks down by source, as a share of total income.
Sources of Retirement Income for Ages 65 and Older
| Income Source | Share of Aggregate Income (65+) |
| Social Security | 29.5% |
| Earnings from work | 27.3% |
| Pensions and retirement savings | 23.8% |
| Asset income, public assistance, and other | 19.4% |
Table 9. Sources of income for the population age 65 and older, 2019 (most recent full composition). Source: Congressional Research Service, report R47341.
Social Security is the single largest source, and for most retirees it is the backbone of the budget: 65% of elderly beneficiaries rely on it for the majority of their income.17 Benefit amounts rose 2.8% with the 2026 cost-of-living adjustment.
Average and Maximum Social Security Benefits: 2025 to 2026
| Beneficiary | Monthly Benefit (2025) | After 2.8% COLA (Jan 2026) |
| All retired workers (average) | $2,015 | $2,071 |
| Aged couple, both receiving | $3,120 | $3,208 |
| Maximum at full retirement age | $4,018 | $4,152 |
Table 10. Average and maximum Social Security benefits, 2025 to 2026. Source: Social Security Administration, 2026 COLA Fact Sheet.
For a medium earner retiring at 65, Social Security replaces roughly 39% to 40% of pre-retirement earnings, well short of the 70% to 85% most planners target from all sources combined.17 The program also faces a funding deadline that shapes long-term planning.
Social Security Trust Fund Depletion Projections
| Trust Fund | Projected Depletion | Benefits Payable at Depletion |
| OASI (retirement and survivors) | 2033 | 77% |
| Combined OASDI | 2034 | 81% |
| Disability (DI) | Not depleted in 75-year window | n/a |
Table 11. Social Security trust fund depletion projections. Source: Social Security Board of Trustees, 2025 Annual Report.
Retirement Readiness and Confidence
The final measure is how prepared people feel, and how that lines up with reality. The table below summarizes the core readiness metrics from the 2026 Retirement Confidence Survey.
Retirement Readiness and Confidence Metrics: 2026
| Readiness Metric (2026) | Workers | Retirees |
| Confident in a comfortable retirement | 61%19 | 73%19 |
| “Very confident” | 21%19 | 25%19 |
| Median expected retirement age | 6519 | n/a |
| Median actual retirement age | n/a | 6219 |
Table 12. Retirement readiness and confidence metrics, 2026. Source: EBRI and Greenwald Research, 2026 Retirement Confidence Survey.
The expected-versus-actual retirement age is the persistent reality check: workers plan to retire at a median age of 65, but retirees report actually leaving at 62, often earlier than planned because of health issues or job changes.19 By the Federal Reserve’s separate measure, only 35% of non-retirees feel their savings are on track.8 Confidence has also slipped from its post-pandemic peak.
Worker Retirement Confidence Trend: 2017 to 2026
| Year | Workers “Very Confident” |
| 2017 | 18% |
| 2021 | 28% |
| 2024 | 24% |
| 2025 | 21% |
| 2026 | 21% |
Table 13. Share of workers “very confident” about retirement, selected years. Source: EBRI and Greenwald Research, Retirement Confidence Survey.
Confidence tracks closely with having a plan: 70% of workers with a retirement plan are confident, versus only 32% of those without one.19 What workers worry about has also shifted toward forces outside their control.
Top Retirement Concerns: 2026
| Top Retirement Concern (2026) | Share of Workers Concerned |
| Government changes to the retirement system | 80%19 |
| Rising housing costs | 70%19 |
| Debt as an obstacle to saving | 65%19 |
| Health care costs hurting their ability to save | Nearly 60%19 |
| Worried about not having enough money (nonretirees) | 69%21 |
Table 14. Top retirement concerns, 2026. Sources: EBRI and Greenwald Research; Gallup.
Worry is sharply uneven by income: 82% of non-retirees in households earning under $40,000 are worried about running short in retirement, compared with 55% of those earning $100,000 or more.21 Generational confidence is lowest among Gen X, where fewer than 1 in 5 workers say they are very confident.20
Retirement Statistics: Frequently Asked Questions
How much does the average American have saved for retirement?
At year-end 2024, the average 401(k) balance was $148,153, while the median was just $38,176.1 The average is pulled up by a small number of very large accounts, so the median is closer to what a typical saver actually holds. Only 54.3% of U.S. households have any retirement account at all.5
How much should you have saved for retirement by age?
There is no universal target, but median balances by age offer a benchmark: roughly $16,255 by your early 30s, $39,958 by your early 40s, $67,796 by your early 50s, and $95,642 in your early 60s.1 Most planners suggest saving enough to replace 70% to 85% of your pre-retirement income from all sources combined.
What is the retirement savings gap?
The aggregate U.S. retirement savings shortfall for households ages 35 to 64 is an estimated $3.48 trillion,6 and 39% of working-age households are at risk of not maintaining their standard of living in retirement.7 The gap is widest for Gen X, who expect to fall about $466,802 short of what they think they will need.9
What percentage of Americans have no retirement savings?
It depends on the group: 20% of adults age 50 and older have no retirement savings,10 36% of non-retired adults have no retirement account,8 and 46% of all U.S. households hold no retirement-account savings.5
Will Social Security run out?
Social Security will not disappear, but its main retirement trust fund (OASI) is projected to be depleted in 2033, after which it could pay about 77% of scheduled benefits.18 Social Security already replaces only about 40% of pre-retirement earnings for a medium earner,17 which is why your personal savings carries so much of the load.
Turning Retirement Statistics Into a Plan
The data points to one consistent theme: the gap between an average balance and a workable retirement plan is wide, and it closes through deliberate, year-over-year decisions about saving, income timing, and Social Security. Numbers like these describe the landscape, but they cannot tell you where you personally stand or what to do next.
References
- Vanguard, How America Saves 2025 (year-end 2024 data). https://corporate.vanguard.com/content/dam/corp/research/pdf/how_america_saves_report_2025.pdf
- Fidelity Investments, Q4 2025 Retirement Analysis (March 2026). https://about.fidelity.com/data-and-insights/q4-2025-retirement-analysis
- Fidelity Investments, Q4 2024 Retirement Analysis. https://www.fidelity.com/about-fidelity/Q4-2024-retirement-analysis
- Fidelity Investments, year-end 2020 to 2022 average 401(k) balances, reported via CNBC, February 2023. https://www.cnbc.com/2023/02/23/401k-retirement-savings-account-balances-sank-in-2022-fidelity-says.html
- Federal Reserve Board, Survey of Consumer Finances 2022, analyzed by the Congressional Research Service (report IF12928). https://www.congress.gov/crs-product/IF12928
- Employee Benefit Research Institute, Retirement Security Projection Model, SECURE 1.0 and 2.0 brief (July 2024). https://www.ebri.org/content/changes-in-retirement-security-from-secure-1.0-and-2.0–evidence-from-ebri-s-retirement-security-projection-model
- Center for Retirement Research at Boston College, The National Retirement Risk Index: An Update from the 2022 SCF (February 2024). https://crr.bc.edu/the-national-retirement-risk-index-an-update-from-the-2022-scf/
- Federal Reserve Board, Report on the Economic Well-Being of U.S. Households in 2024 (May 2025). https://www.federalreserve.gov/publications/2025-economic-well-being-of-us-households-in-2024-savings-and-investments.htm
- Schroders, 2024 U.S. Retirement Survey. https://www.schroders.com/en-us/us/individual/media-center/as-oldest-gen-xers-approach-age-60-many-are-unprepared-for-retirement-and-concerned-about-outliving-their-assets/
- AARP, New AARP Survey: 1 in 5 Americans Ages 50+ Have No Retirement Savings (April 2024). https://www.aarp.org/press/releases/2024-4-24-new-aarp-survey-1-in-5-americans-ages-50-have-no-retirement-savings.html
- Plan Sponsor Council of America, 68th Annual Survey of 401(k) Plans (2024 plan year). https://www.psca.org/news/psca-news/2025/11/psca-annual-survey-participation-climbs-as-employers-embrace-secure-2.0-flexibility
- U.S. Bureau of Labor Statistics, Employee Benefits in the United States, March 2025. https://www.bls.gov/news.release/pdf/ebs2.pdf
- Internal Revenue Service and U.S. Treasury, SECURE 2.0 Act automatic enrollment requirements, effective January 1, 2025. https://www.paychex.com/articles/compliance/secure-act-auto-enrollment-mandate
- Congressional Research Service, Income for the Population Ages 65 and Older (report R47341, 2019 income data). https://www.congress.gov/crs-product/R47341
- U.S. Census Bureau, Retirement Income: 2022 (report P70FS-207, January 2025). https://www.census.gov/content/dam/Census/library/factsheets/2025/demo/p70fs-207.pdf
- Social Security Administration, 2026 Cost-of-Living Adjustment Fact Sheet. https://www.ssa.gov/news/en/cola/factsheets/2026.html
- Center on Budget and Policy Priorities, Top Ten Facts About Social Security (2024). https://www.cbpp.org/research/social-security/top-ten-facts-about-social-security
- Social Security Board of Trustees, 2025 Annual Report (June 2025). https://www.ssa.gov/oact/tr/2025/
- EBRI and Greenwald Research, 2026 Retirement Confidence Survey (April 2026). https://www.ebri.org/content/2026-ebri-greenwald-retirement-confidence-survey
- Transamerica Center for Retirement Studies, 25th Annual Retirement Survey (2025). https://www.transamericainstitute.org/research/retirement
- Gallup, Nonretirees’ Worry About Retirement Remains High (2025). https://news.gallup.com/poll/709319/nonretirees-worry-remains-high.aspx
*The opinions voiced in this material are for general information only and are not intended to provide specific advice or recommendations for any individual. All performance referenced is historical and is no guarantee of future results. All indices are unmanaged and may not be invested into directly.