An individual retirement account (IRA) is one of the most widely held retirement savings vehicles in the United States, with total IRA assets reaching $19.2 trillion at the end of 2025, or roughly 39% of all retirement assets nationwide. Yet a single average can be misleading. Balances vary enormously by age, by account type, and by how an account was funded. This page compiles the most current IRA balance data available as of mid-2026, broken into three views: how balances grow across age groups, how traditional and Roth accounts differ, and how typical balances measure up against common savings benchmarks.
The figures below are drawn from primary industry research, including Empower Personal Dashboard account data, Fidelity Investments’ quarterly retirement analyses, the Investment Company Institute (ICI), the Employee Benefit Research Institute (EBRI), and survey data from Bankrate. One note on reading these numbers: averages and medians tell different stories. Averages are pulled upward by a small number of very large accounts, while the median (the midpoint, where half of savers hold more and half hold less) better reflects what a typical account holds. Both are shown wherever the underlying data allows. Balance figures by age reflect the reporting structure of the source databases, which group savers by decade.
This article is for informational and educational purposes only and does not constitute investment, tax, or financial advice. Figures reflect the most recent data available at the time of writing and will change over time. Individual results vary based on income, contribution history, market performance, and personal circumstances.
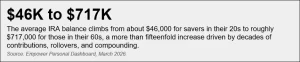
Average IRA Balance by Age
IRA balances follow a clear life-cycle pattern: modest in early adulthood, accelerating sharply through peak earning years, and leveling off or drawing down in retirement. The largest jumps occur between the 30s and 50s, when incomes typically peak and many savers consolidate former workplace plans into IRAs through rollovers. The gap between average and median balances also widens with age, a sign that high-balance accounts pull the average well above what most savers actually hold.
Average and median IRA balance by age group
| Age group | Average IRA balance | Median IRA balance |
| 20s | $46,107 | $7,893 |
| 30s | $88,291 | $15,451 |
| 40s | $215,206 | $42,427 |
| 50s | $483,451 | $140,597 |
| 60s | $716,661 | $262,614 |
| 70s | $712,572 | $271,107 |
| All savers | $281,280 | $41,084 |
Source: Empower Personal Dashboard, March 2026. Figures reflect account holders who use Empower’s online dashboard and include traditional, Roth, and rollover IRAs.
The contrast between average and median is the key takeaway. Across all savers, the average IRA holds $281,280 while the median is just $41,084, meaning a relatively small share of large accounts lifts the average to nearly seven times the midpoint. For savers in their 60s, the median of about $263,000 is a more realistic picture of a typical balance than the $717,000 average. Provider datasets also differ: account holders who actively use online financial dashboards tend to save more than the broader population, so figures from firms with wider account bases run lower. Fidelity, which analyzes nearly 20 million IRA accounts, reported an all-account average of $131,400 in early 2026, well below dashboard-based averages.
Year-over-year trend in the average IRA balance
| Period | Average IRA balance | Change vs. prior year |
| Q4 2024 | ~$128,100 | Baseline |
| Q4 2025 | $137,095 | +7% |
| Q1 2026 | $131,400 | +8% |
Source: Fidelity Investments Q4 2025 and Q1 2026 retirement analyses (all-account averages across roughly 19 to 20 million IRA accounts). The Q4 2024 figure is implied from Fidelity’s reported 7% year-over-year increase.
Despite market volatility, average IRA balances have risen year over year, supported by record contribution activity. Fidelity reported that IRA contributions rose 29% year over year heading into 2026, with a record number of account holders making deposits. The quarter-to-quarter dip from late 2025 into early 2026 reflects market movement rather than reduced saving; balances would have fallen further without the surge in contributions.
Balance by IRA Type
Not all IRAs grow the same way. Traditional and rollover IRAs tend to hold substantially more than Roth IRAs at every age, largely because of how they are funded. Roughly two-thirds of IRA accounts are traditional or rollover accounts, and most traditional IRA owners report that their balances include money rolled over from a former employer’s 401(k) or similar plan. Roth IRAs, by contrast, are built mainly through annual contributions and are subject to income limits, so they accumulate more gradually.
Average balance by account type and age: overall IRA vs. Roth
| Age group | Overall IRA average | Roth IRA average |
| 20s | $46,107 | $45,637 |
| 30s | $88,291 | $74,695 |
| 40s | $215,206 | $118,663 |
| 50s | $483,451 | $167,423 |
| 60s | $716,661 | $213,130 |
| 70s | $712,572 | $233,872 |
Source: Empower Personal Dashboard, March 2026. “Overall IRA” includes traditional, rollover, and Roth balances and is weighted heavily toward traditional and rollover accounts; the gap between the two columns reflects traditional and rollover holdings.
The two account types track closely in a saver’s 20s but diverge sharply with age. By the 60s, the overall IRA average is more than three times the Roth average, a spread driven almost entirely by rollover activity that flows into traditional accounts as workers change jobs and retire. EBRI’s account-level data shows the broad mix: about 34% of IRAs are traditional contributory accounts, 33% are rollovers, 23% are Roth, and the remainder are SEP and SIMPLE IRAs. Because Roth accounts are funded by contributions rather than large rollovers, and because they carry no required minimum distributions for the original owner, their balances tend to grow steadily and persist later in life.
Contribution by type: share of IRA contributions going to Roth, by generation
| Generation | Roth share of contributions | Traditional share |
| Gen Z | 95% | 5% |
| Millennials | 75% | 25% |
| Gen X | 66% | 34% |
Source: Fidelity Investments Q3 2025 retirement analysis. Shares reflect the portion of IRA contribution dollars directed to Roth versus traditional accounts.
Younger savers overwhelmingly favor Roth accounts: Gen Z directs roughly 95% of its IRA contributions to Roth, compared with about two-thirds for Gen X. Older savers lean more traditional, and they also contribute more in dollar terms. Fidelity reported an average IRA contribution of about $3,231 in early 2025, rising to roughly $5,272 for Baby Boomers, who can take advantage of higher catch-up limits. For 2026, the IRA contribution limit is $7,500 for those under 50 and $8,600 for those 50 and older. Household survey data from ICI reinforces the Roth tilt among contributors: among households that contributed to an IRA for tax year 2023, 56% put money only into a Roth, 32% only into a traditional, and 12% into both.
How Balances Compare to Targets
A common way to gauge retirement readiness is to compare savings against salary-based benchmarks, such as having one times your salary saved by 30 and ten times by retirement age. An important caveat applies to IRAs specifically: these benchmarks measure total retirement savings across all accounts, not an IRA in isolation. For most households, an IRA is one component of a broader picture that also includes 401(k) and other workplace plans. The table below compares average total retirement balances by age against the benchmark for that age, using a widely cited milestone framework.
Average balance vs. recommended savings benchmark by age
| Age group | Benchmark (x salary) | Target balance | Average balance | Progress to goal |
| 20s | 1x | $49,954 | $100,763 | 202% |
| 30s | 3x | $193,931 | $199,600 | 103% |
| 40s | 6x | $423,145 | $401,838 | 95% |
| 50s | 8x | $552,906 | $617,259 | 112% |
| 60s | 10x | $649,572 | $573,081 | 88% |
Source: Empower Personal Dashboard (average balances, July 2025), with salary-based targets scaled to income using U.S. Bureau of Labor Statistics and U.S. Census data. Balances reflect total retirement savings, of which IRAs are one part; the benchmark applies to all retirement accounts combined.
Measured this way, savers in their 20s, 30s, and 50s sit at or above their benchmarks on average, while those in their 40s and 60s land slightly below. The 40s gap reflects a decade of competing demands such as mortgages, childcare, and tuition, while the 60s shortfall partly reflects that some savers have already begun drawing down their accounts. As always, averages flatter the picture: medians sit well below these averages, so the typical household is further from the benchmark than the average suggests.
Share of savers on track vs. behind
| Self-reported status | Share of workers |
| Behind (total) | 58% |
| Significantly behind | 37% |
| Slightly behind | 21% |
| On track | 22% |
| Ahead of where they should be | 13% |
| Not sure | 7% |
Source: Bankrate 2025 Retirement Savings Survey. Shares reflect workers’ own assessments of their progress.
Sentiment data tells a more sobering story than balances alone. Roughly 58% of workers say their retirement savings are behind where they should be, including 37% who feel significantly behind, while only about one in five feel on track and one in eight feel ahead. Older workers are the most likely to feel behind, a reflection of the shorter runway they have to close any gap. Taken together, the data points to a consistent theme: headline averages are buoyed by a minority of large accounts, medians reveal a more modest reality, and most savers themselves sense they have ground to make up.
Plan Your Retirement Savings with YTS Wealth Management
Understanding how your IRA stacks up against your peers is a useful starting point, but benchmarks are only averages. A personalized plan accounts for your income, account mix, tax situation, and timeline. To build a retirement savings strategy tailored to your goals, visit ytswealth.com.
References
- Empower Personal Dashboard. “Average IRA balances by age: Traditional & Roth.” empower.com. Data as of March 2026. (Average and median IRA and Roth IRA balances by age and generation.)
- Empower Personal Dashboard. “Retirement savings goals 2025.” empower.com. Data as of July 2025. (Average balances vs. salary-based benchmarks by age group.)
- Fidelity Investments. “Q4 2025 Retirement Analysis.” about.fidelity.com. 2026. (Average IRA balance and year-over-year change; contribution trends.)
- Fidelity Investments. “Q1 2026 / Q3 2025 Retirement Analysis.” about.fidelity.com. 2025 to 2026. (All-account average IRA balance, contribution growth, and Roth contribution shares by generation.)
- Investment Company Institute (ICI). “The Role of IRAs in US Households’ Saving for Retirement, 2023” and ICI Research Perspective, Vol. 31, No. 2. ici.org. 2024 to 2025. (IRA contribution patterns and total IRA assets.)
- Employee Benefit Research Institute (EBRI). EBRI IRA Database. ebri.org. (Distribution of IRA accounts by type.)
- “2025 Retirement Savings Survey.” bankrate.com. 2025. (Self-reported share of workers on track versus behind.)
- Internal Revenue Service (IRS). “IRA contribution limits.” irs.gov. 2026. (Annual contribution and catch-up limits.)
- S. Bureau of Labor Statistics and U.S. Census Bureau. Earnings and population data. bls.gov; census.gov. 2025. (Income inputs for salary-based benchmarks.)